
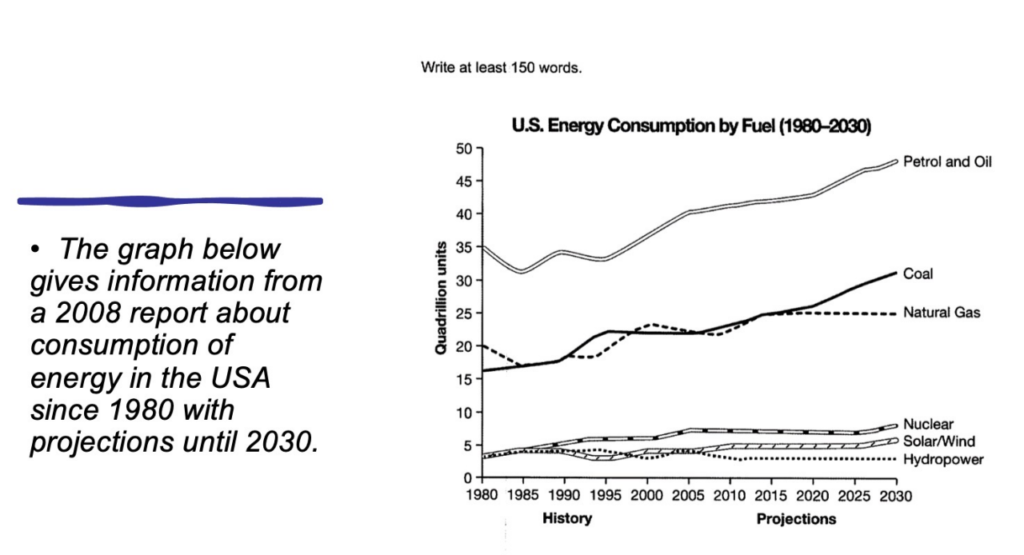
The shown line chart represents the useage figures for distinct energy sources in America between 1980 and 2030 from a message.
According to the graph above, the data for petrol and oil showed a dramatic rising trend with a few fluctuations and which is far more than other categories of energy sources. At the same time, it is obvious that the usage of coal increased gradually from 1980 (16 quadrillion units) to 2024 (27 quadrillion units) and is projected to increase to reach 30 in 2030 based on the prediction. On the other hand, the development of natural gas grew slowly from 1980 to 2024 and will almost remain stable in the future.
It is clear from the data that the amount of clean energy generally rose slightly from 1980 to 2024 and will continue to keep steady in the future, particularly the figure of hydropower experienced a minor fluctuation between 1980 and 2010 and returned its original level.
the utilization of fossil fuel kept a obvious increase over the past 4 decades and will remain a constant upward trend in the next 7 years.
In general, fossil fuel dominated the energy market and will keep their advantage in the future. In contrast, the clean energies only accounted for a small percentage in the utilization of energy.