
A simple practice
Task 1 2024-01-23
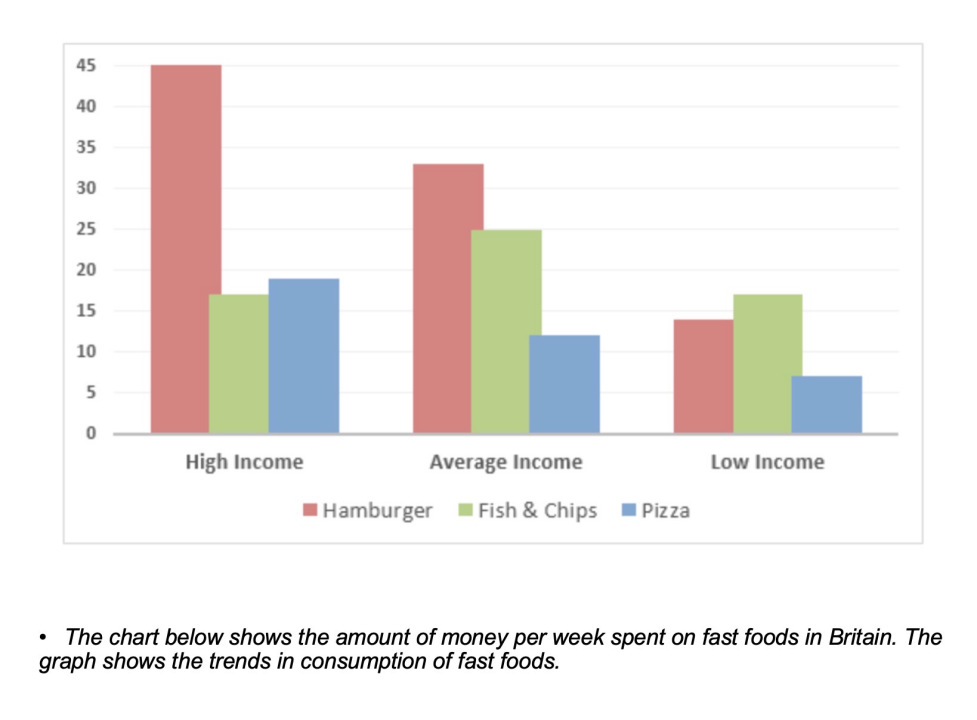
The provided bar graph illustrates the data of expenditure of fast foods weekly and the tendency expense of fast foods in Britain.
In terms of the preference of the high income citizens, it is obviously that the figure of hamburger is much more than others. The rest two types of fast foods have the similar data at approximately 16.
When it comes to the number of middle class, we can see that hamburgers are purchased by guests at most(33), followed by fish & chips (25) and pizza (12) respectively.
It is interesting to note that the popularity of fast foods in population who with weak financial status. Among this group, customers are more willing to buy fish & chips, by contrast, the figure of hamburger and pizza are at about 14 and 6.
It can be clearly seen that, hamburger is generally the most popular food among diverse classes of residents, while the pizza is the least popular choice across consumers with distinct level of income. Besides, the rich spend more on fast foods than the poor.